Data Visualization via Sushovan's Eye
Monday, 6 February 2017
Dashboard via Tableau
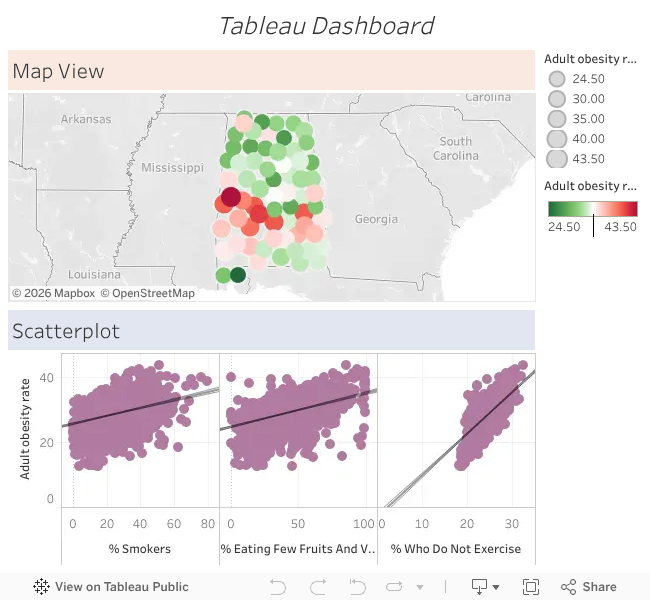
Finally the dashboard with two tiles in Tableau. Here you can observe the two tiles explaining scatter plot and map view.The reference to the dataset is
here
.
No comments:
Post a Comment
Older Post
Home
Subscribe to:
Post Comments (Atom)

No comments:
Post a Comment